Overall, your team’s goal for this step is to prepare the public presentation of findings and next steps. While discussions and findings may need to remain internal for now, the core team may find it worthwhile to consult with civil society and similar external stakeholders before the publication in Section 6.2. These moments are flagged below. 

Get your team on the same page 

Convene the core team to discuss insights and feedback on the results of the data collection process. Ask questions of the team’s data analyst(s), agree on a list of key takeaways and draft at least one idea for what a response to public feedback will involve. Prepare to share a summary of the process, the key findings and this list of potential responses with internal stakeholders. 

What will this look like?

The core team’s exact output from this meeting will depend on the structure of your team, the norms of your municipal administration and the significance of the decision to be taken. Is it necessary to draft a formal report or memorandum with recommendations endorsed by the team that will be circulated within the municipal administration, or can the core team follow up more informally with municipal and civil society stakeholders to prepare the public report?

If your team is composed of elected officials (direct engagement model), then the team may have the authority to decide on next steps. Or, if your administration is smaller and more flexible in its approach, a less formal discussion or memorandum may be suitable. It will still be necessary (and wise), however, to huddle with department heads and relevant staff within the municipal administration to understand the feasibility of potential responses, discuss their concerns, ensure their buy-in and plan next steps in greater detail. 

If your team is composed of staff (supervisory engagement), or your municipality has an expectation of formal bureaucratic process, then sharing findings may require a more formal approach – for example, a formal memorandum or brief, slide deck/PowerPoint presentation, or longer report that is shared and presented to municipal leadership and stakeholders. In this situation, the internal report will grow to include a higher level of detail and preliminary reflections on potential feasibility, costs, a mapping of responsible departments and other considerations. 

Prepare to share findings with relevant stakeholders

Next, share your findings with relevant stakeholders. This initial sharing (or initial validation of results) should be targeted and involve members of the municipal administration and civil society rather than the community as a whole. 

You have a few different goals for the initial, internal presentation meeting (or series of meetings, for example, if you are meeting with leadership, agencies and a council body separately). 

  1. Share the results of the survey with relevant colleagues and leadership.
  2. Listen to and record comments and insights from colleagues and leadership for any potential revisions. Findings and next steps should be reviewed and discussed among local authority officials and staff to ensure the municipality can deliver on them.
  3. Win the buy-in and support of leadership and colleagues on next steps. Your team will need to explain what findings and potential next steps mean in practice for colleagues, council members, agencies and municipal staff.
  4. Prepare for the immediate public communication of findings and next steps.

Consider the following: 

If these priorities are acted on, who would need to be involved? Will political or budgetary implications impact feasibility? This will help you determine which agency heads, staff, council members and other stakeholders should be invited to discuss the findings before the launch/announcement of the data. At this stage in the process, your data should point to one or more public priorities that the local authority will address. Is a public or government service a major source of dissatisfaction? Will an investment need to be made to provide or repair infrastructure, such as a sewer or road? Anticipate and prepare to respond to critics or opponents of your team or potential plans.

How likely are internal stakeholders to accept your findings? Are your findings sound? This is an opportunity to bring in civil society leaders – if certain members of the local authority’s administration are reluctant to accept your findings or your data, they may be able to back you up by providing testimonials, additional and related data, or other information. 

Will findings be considered sensitive or antagonistic? Consider who within the local authority should be engaged before any public announcement and how your findings and proposed solutions should be phrased. For example, the local agency responsible for streets may take it as a personal attack if the survey indicates low resident satisfaction there. Briefing the mayor and top leadership first to discuss and frame the presentation of the data and then having them present findings to the broader municipal administration may be helpful.

What will the public think about your response? What are their expectations? This is another place where engaging civil society can help you plan your public outreach. They can provide insight into how the public will receive your planned responses, which can help to increase your ambitions or frame your publication if responses fall short of public expectations.

Does the presentation link to existing processes and discussions? Where possible, this internal presentation should be linked to existing processes. For example, if the municipality conducts a regular planning meeting, develops or periodically updates an internal or formal strategy, or otherwise convenes all local authority staff (e.g., all-hands or all-staff meeting, direction setting meeting), adding this presentation as a component of those events can help connect findings more directly to the municipality’s problem-solving and planning efforts.

Advice for presenting results

Designing your presentation

Your team may be asked to present the findings and lead discussions of next steps through a presentation. This should include the following elements: 

  1. Remind the audience about the objective of the feedback loop process, the data collection approach and why public opinion matters for the local authority.
  2. Clearly summarize your findings, preferably organized thematically.
  3. Propose next steps based on your findings, discuss how you and your colleagues in the local authority can respond to feedback and report to the public.

When preparing your presentation, keep in mind your audience. 

  • Who will you present to? Will this be a meeting to update the mayor on your findings? Will other stakeholders, such as the heads or staff of other departments and agencies, be in the room?
  • Consider your audience’s perspectives, and most importantly, take a moment to think about what they will find valuable about your data. Does it align with their strategies and their views of how to improve the community? Are they likely to agree or disagree with it? Can it help them do their jobs better?
  • Consider how people receive and process information. Will visuals be helpful? Do you have photographs of outreach or data collection activities? Will you prepare handouts or one-page summaries?

Consider the following tips when developing your presentation or PowerPoint slide deck:78

  • Make sure your data can be seen – Are you using charts and graphs, and are they large enough for the audience? Is the important text legible from a distance?
  • Focus on main points – Use phrases like “This data shows [safe roads are the highest priority]” or “This chart illustrates [that young people preferred arts programs in schools, while older residents prioritized green space].”
  • White space is your friend – If using a slide deck, make one point per slide, and write a slide title that states the point – “Resident preferences” is a weaker slide title than “Residents prefer safer roads.” Make sure the data on that slide backs that point up.

The core team member or members focused on data and communication can support the presentation by preparing different visuals for presenting the data. Review the differences in Box 20 to understand how visuals can be polished and prepared to be most easily read and understood.
Remember 

Communities face complex, wicked problems. Communities have been described as living organisms, with unique characteristics and constant interactions between the people living within them and the environment. As a consequence, relying on your data to arrive at conclusions and recommendations will involve managing and accepting a level of uncertainty about how representative and accurate your data is and what to do about it. Avoid leaping to conclusions from the data – instead, try to remember that the data is a snapshot of this sample of the public’s view. It is evidence that can support conclusions or plans of action, but no survey is definitive proof that a single course of action is the right one. People get things wrong or change their minds, and sometimes priorities are beyond the scope or resources of a community to resolve alone. In the next section, we’ll discuss how to work with your team and colleagues to determine how to respond to the data.

Box 20. Presenting survey data findings to the public

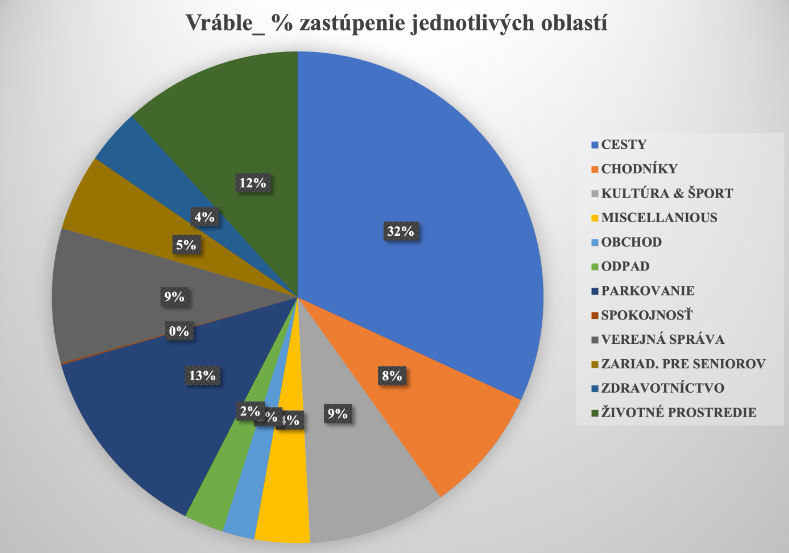
Figure 4 presents a pie chart showing original response data from residents of Vráble, Slovakia, indicating the percentage representation of various issue areas. The largest share of responses (32%) relates to roads (CESTY), followed by 13% for public administration (VEREJNÁ SPRÁVA) and 12% for the environment (ŽIVOTNÉ PROSTREDIE). Other notable categories include waste management (ODPAD, 9%), culture and sports (KULTÚRA & ŠPORT, 9%), and sidewalks (CHODNÍKY, 8%), with smaller proportions distributed across areas like health care, senior services, and public satisfaction.

Figure 4. Internal, original response data from the residents of Vráble, Slovakia

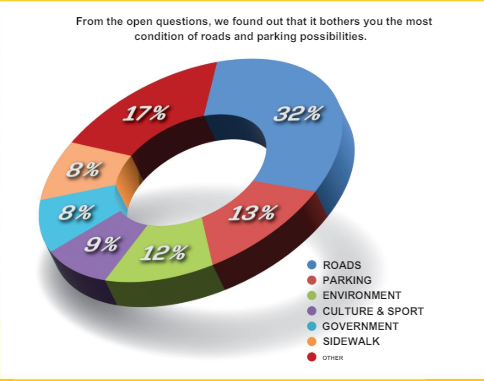
Figure 5 displays a donut chart summarizing publicly presented response data from Vráble residents. It highlights that the most frequently mentioned concerns were roads (32%) and parking (13%). Other categories include environment (12%), culture and sport (9%), government (8%), sidewalks (8%), and a general “other” category (17%). The chart emphasizes that road conditions and parking were the top issues raised in open-ended responses.

Figure 5. External, public presentation of response data from Vráble

Compare these two pie charts. Both were created from the same set of survey data. Which one is easier for a member of the public to understand and read?

The top pie chart is the original presentation of findings emerging from the survey of residents in the city of Vráble, Slovakia. Compared to the bottom graphic, the top one is more difficult to read – there are too many categories, the colors are not very distinct, the writing is too small and one number is even hidden behind another. In addition, the order of issues presented in the legend does not align with their respective scores (i.e., they are not listed in order from higher to lower vote count). 

When presenting to the public, the government instead used the pie chart on the bottom left. What improvements do you observe? First, they focused only on the top six issues, grouping some smaller issues together and creating a larger “Other” category. This simplifies the chart, making its conclusions easier to grasp. Second, the legend of the chart lists the labels in order from highest to lowest priorities. The title of the chart also states the top two priorities: roads and parking. The numbers are large, legible and clear. The colors of the chart are distinctive, and the presentation is more attractive. 

Explaining and building trust in your data 

In your presentation, you should briefly describe your methodology. Your goal here is to build trust in and credibility of the data. For example, you should briefly describe how you distributed the surveys, how many surveys you handed out and how many you received in response. The same is true for other data collection methods. This can be captured in a graph or map of the local community, depending on what methods you used. It is important to be clear but also concise when describing your methodology.

Example discussion of methodology

“There are approximately 1,500 houses in the community, with approximately 4,500 residents. We distributed surveys in two ways: we selected 200 households (50 in each of the four similarly sized neighborhoods) and handed out 450 surveys this way. We also conducted convenience sampling at the local market on two major weekends and handed out another 200 surveys. Overall, we received 450 surveys back over the two weeks (so from 10% of residents). These are their responses . . .” 

Building trust in your data during this presentation is important to securing buy-in among leaders. It is especially important if residents describe dissatisfaction in a particular public or government service (as a responsible agency staff may feel understandably defensive and question the validity of your data). In addition, your data’s quality is important because the local authority will use it to make decisions. If you reached a sufficient number of residents, this should provide generally robust data. If your data outreach isn’t sufficiently robust (you didn’t hit your sample size goal) or is based exclusively on focus groups or interviews, you will need to explain its limitations – and frame your presentation accordingly as recommendations and anecdotes (rather than broadly representative of diverse and inclusive community views). Use phrases such as “This is what we heard . . .” rather than “This is what we know . . .”

Remember

A sample size helps you to be confident that survey data is “representative.” Even if you don’t receive as many responses as planned, that doesn’t mean the data is worthless – these are still real opinions from real residents and have value. That said, you cannot argue that your results represent the opinions of the whole community; instead, the results are a useful starting point. No matter what, you will take steps to validate your plans later on (Step 7). Refer to Annex IX for more details on sample sizes. 

If you have demographic data about your survey respondents, focus group participants, and interview subjects, share it if it relates to your findings or affects trust. For example, “We reached a roughly equal number of men and women.” In addition, share any interesting differences revealed by disaggregated data: “Women under the age of 40 tended to prioritize issue X, while men under the age of 40 tended to prioritize Y,” and so on.

Show the value and relevance of your data

To get buy-in from key leadership, clearly explain the value and importance of this data to their goals. Answer the questions, “So what? Why does this matter?” Connect the data findings (and the process) to the goals and daily objectives of the municipality. Refer back to the problem you are trying to solve, whether that’s to create a strategy, refine a plan, or set budget priorities. How does this data fill a gap? Data on public priorities should connect directly to the process of local administration and governance. Public feedback should not exist in a separate realm from the day-to-day business of your municipality. Use this meeting and discussion to create that connection to the work plans, strategies and processes of your colleagues in the municipal administration. 

Next steps – Determine what your response will be

During this process, work collaboratively with colleagues and leadership on a preliminary set of politically and fiscally feasible solutions – potentially within relevant time horizons (e.g., within a fiscal year, ahead of the next elections).

Your finance and operations department can help your team understand the state of the local authority’s revenues. If no money is available, consider the feasibility of raising money through grants from alternative sources, such as the central government, foundations or private groups and businesses.  See Box for an example.

Box 21. Learn from experience - Fundraising in Moldova

In Moldova, after surveying the public, officials in Cărpineni municipality were determined to update the local water supply infrastructure. However, they lacked money and resources. To overcome this challenge, the municipality organized financial donations from 500 local residents. This demonstrated strong community support for the project and helped to make initial headway. Later, backed by this show of support and findings from public feedback, the city won support from an external donor to fund the large remainder of the project. 

Your team’s initial data analysis may indicate a prioritized issue is a “wicked problem” (see the discussion in Section 1.2) that is beyond the capacity or authority of the local authority to address it directly. In these instances, your presentation of solutions to leadership and civil society will be different, focusing instead on how the local authority might engage with regional (meso-level) or central government representatives (such as ministries or transit authorities), who are in a position to address the issue. In this advocacy role, your local authority can leverage data gathered to make the case. The problem may be shared across multiple municipalities or local authorities, necessitating outreach to neighboring peer governments for collaboration and resource sharing. 

It will also be worthwhile to evaluate whether any priorities shared by the community offer the opportunity to declare “quick wins” – are there small-scale projects or policy changes that can be implemented immediately?

Footnotes

78Adapted from: Joel Schwartzberg, Present Your Data like a Pro (Harvard Business Review, 2020), Link.