@media print { .callout-box { border: 1px solid #000; /* Black border for visibility in print */ padding: 15px; /* Padding to create space inside the box */ background-color: #f9f9f9; /* Light background color for contrast */ margin: 20px 0; /* Margin to space out the box from other content */ box-shadow: none; /* Remove any box-shadow */ } } Print Friendly and PDF

After consulting with the local authority and initial outreach to civil society, your team’s next step is communicating with the public to validate your findings. Publish your findings with at least a brief outline of your next steps, including preliminary solutions.  

This report is the first time the public is seeing and hearing a summary of its feedback. This is a key moment for trust building, as your team directly answers the resident asking, “Did you hear my opinion? Does my opinion matter?” with a resounding “Yes! We heard you – here’s what we’re doing about it (and how you can get involved).”

Generate a publication: Reporting on results and next steps

The publication should describe the findings and indicate proposed next steps. Follow the guidance for presenting survey results discussed earlier and refer to the examples provided in Box 22. In addition, a template with detailed instructions for this publication can be found in Annex XI: Public Reporting Templates.

Regarding next steps, determine whether you intend to enter into dialogue with the public to codesign solutions (see Step 7) or – if you are already prepared to take specific actions on the priorities identified in the survey – whether you are prepared to present actions to be taken now. If you intend to seek further input from the public, provide instructions or further information on how residents can get involved.

Ensure the form and content of the publication (or handout, pamphlet or report) is accessible to diverse residents. Use simple rather than technical language, explain any complex terminology, structure the report in an organized way and avoid crowding the space with too much text. Consider also whether multiple language versions and easy-to-understand visual aids (like the bottom pie chart in the Moldova example in Box 22) should be used so that people with low literacy levels can more easily grasp the key issues being discussed. 

How will your team distribute and communicate this information to the public? It can take the form of a hard copy that is printed and distributed through the mail or a local newspaper, or it can be a PDF or similar file that is published online. You can distribute the materials through public meetings, local media, or online through the municipal website or social media. However, if you plan to communicate with residents, try to reach as many people as possible. 
Box 22. Learn from experience - Creatively collecting citizen responses

In Moldova and Slovakia, for example, the teams distributed their respective publications as a two-sided handout that included the results of the surveys and the top one to three local issues (according to survey results) that the municipality identified as its immediate priorities. See Box 23 for examples of two publications used by local officials in these countries.

In Moldova, given the small size of many communities (especially those with fewer than 300 households), these publications were distributed door to door to each household. In larger municipalities, they were mailed. During the COVID-19 pandemic, however, these results letters and other information about progress were shared virtually, occasionally using chat groups created on the messaging application Viber, which is popular in the country. Some mayors also used Viber groups to issue surveys. In Slovakia, on the other hand, these publications were mailed out with the municipality’s newspaper; local city newspapers are a common feature of local communities in Slovakia and have a wide readership. They therefore presented an inexpensive and efficient option to reach a large number of local residents.

Box 23. Examples of survey results and next steps publications

Vráble, Slovakia

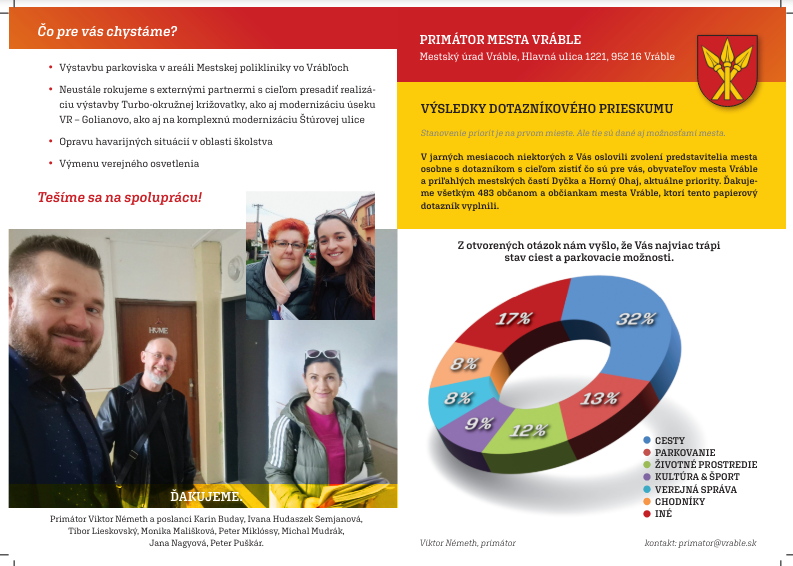
This image is a public flyer from the city of Vráble summarizing survey results and planned municipal actions. On the right, a donut chart highlights key resident concerns, with roads (32%) and parking (13%) cited most often. The text explains that 483 residents participated in the paper-based survey, with open responses showing widespread concern about infrastructure. On the left, the flyer outlines upcoming projects, including parking construction, road modernization, emergency school repairs, and streetlight replacement. Photos of local officials accompany a thank-you message, reinforcing a tone of collaboration and civic engagement.

This is the first page of the two-page handout from Vráble, Slovakia. This flier was printed and included as an insert in the local newspaper distributed throughout the community. Local newspapers are a common, widely read feature in local communities in Slovakia, making this method of distribution relatively inexpensive and effective. 

On this first page, in the top left, the government outlines four actions it is taking or has taken: adding parking to the local health clinic, planning for improvements to a local roundabout and street, improving emergency response, and replacing streetlights. The mayor and his team are in the pictures, demonstrating their door-to-door canvassing activities. On the right side of the page, titled “Results of the Survey,” the team summarizes the survey process and findings: “This spring, some of you were approached by elected representatives personally with a questionnaire.” Readers are then provided the results in a handy pie chart. Note that the government took the actions in the top left before the survey but is highlighting them as they align with the survey’s results.

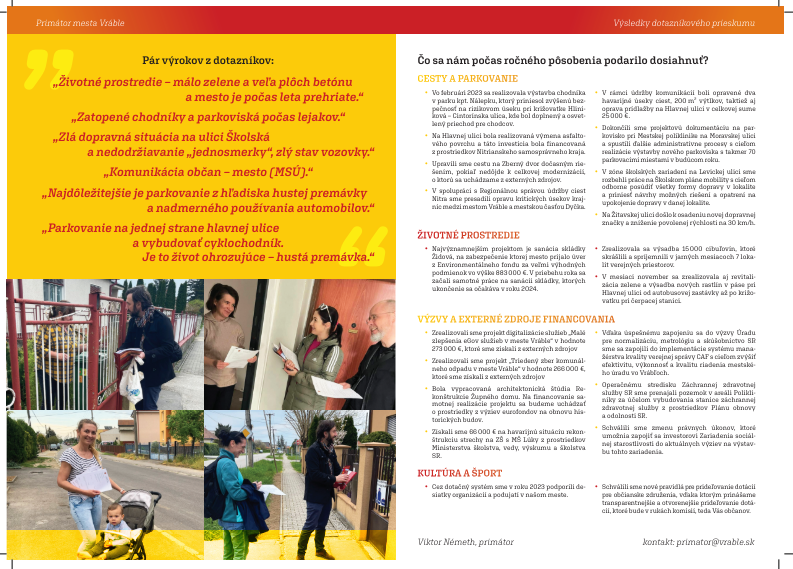
The back page of the handout is reproduced below. On the left side, quotes from the open-ended section of the questionnaire are included. For example, “Flooded sidewalks and parking lots during downpours” and “There is a bad traffic situation on Skolska street: people do not obey ‘one-way’ signs and the road isn’t in good condition.” On the right side of the newsletter is the government’s summary of its actions and achievements after one year in office – for example, repairs to a school roof and local road, the rehabilitation of a local landfill and investments in local green space. This is a kind of response to the feedback loop, even if these actions were taken before the data was collected – it is still an effort to demonstrate responsiveness. Note that the sections of this part of the report match (in order) with the priorities of the survey from the first page. 

This image is a continuation of the public flyer from the city of Vráble, featuring direct quotes from survey respondents on the left and a summary of achievements over the past year on the right. Residents expressed concerns about poor road conditions, lack of greenery, summer heat, flooded sidewalks, heavy traffic, and parking issues. The right-hand side outlines completed improvements in roads, parking, the environment, external funding, and cultural infrastructure—such as sidewalk repairs, parking expansions, tree planting, and successful project financing. Photos show community engagement through door-to-door surveying.

Trușeni, Moldova

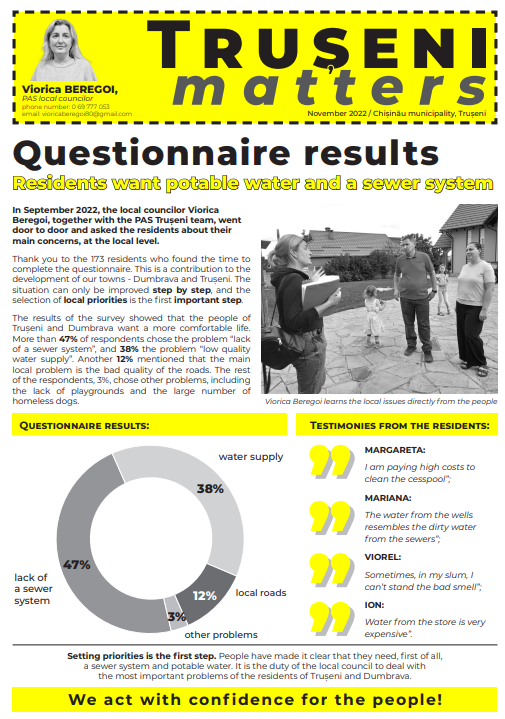
This flyer presents the results of a 2022 community survey in Trușeni, Moldova, led by local councilor Viorica Beregoi and the PAS Trușeni team. The main concerns identified were lack of a sewer system (47%) and inadequate water supply (38%), followed by issues with local roads (12%) and other minor concerns (3%). Resident testimonials emphasize high costs and poor quality of water and sanitation. The flyer underscores that addressing water and sewer infrastructure is the top priority for improving daily life in Trușeni and Dumbrava.

Consider this two-sided report on the results of a survey conducted in the city of Trușeni, Moldova. Note that this handout has been translated into English from the original Romanian.

First, the report summarizes the questionnaire process and results. In addition to a chart, it includes brief quotes from residents. 

This flier has a large amount of text, which is not always effective, but the bottom line is clear: “Residents want potable water and a sewer system.” 

This bottom line is verified and backed up by the data immediately below it. 

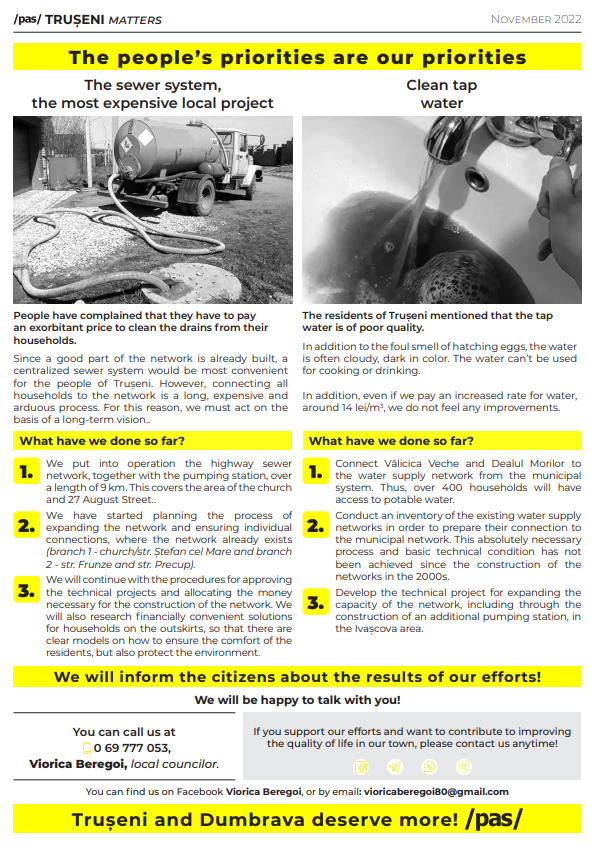
On the second page (or back) of the handout, these two priorities are examined in more detail. First, the sewer system (which received the most votes) is described. Constructing a sewer system is an expensive, time-consuming project – and the local council member is clear about that. She lays out a long-term vision, explaining what has been done so far. She breaks down the problem: the existing infrastructure, the plan for connecting to other parts of the city, and finally, a plan for funding the network while still addressing distant residents “on the outskirts” who might not be reached by this system. 

Next, the issue of dirty tap water is discussed. A certain number of households can be connected to a clean central system. The other networks will be evaluated, and new construction is planned.

Finally, the team promises to follow up with the public and request input, providing contact details by phone, email, and social media.

This flyer highlights infrastructure priorities in Trușeni and Dumbrava, Moldova, focusing on the sewer system and clean tap water—two key concerns raised by residents. The left section explains the need for a long-term plan to expand the existing sewer network, citing high costs and limited coverage. The right section addresses complaints about poor-quality tap water, including bad odor and discoloration. Progress updates are provided: the sewer system has seen highway and pump station upgrades, planning for expansion, and model household connections; meanwhile, over 400 homes have been connected to the water system, with further technical assessments underway. The flyer emphasizes transparency and ongoing communication with citizens.

Template: Report to the public

Below is a sample template based on country experience that can be used to share findings with the public. It is not prescriptive, and innovation is encouraged.

City name                                                                 Date 

Image placeholder

Picture(s) of outreach event or issue/problem if tangible and visible

Overview of the process: What you did, why and when

Provide a 2–3 sentence summary of the survey process. How many people were reached, by what method and when? How many surveys did you receive? 

Consider including a photo of the outreach process – this is further evidence that you did, in fact, speak to real people in the community. 

Results: Number of people who responded, with a graphic or image of the results

Display the results of the process visually – a pie chart or other infographic is a simple way to do this, especially if you are simply ranking issues by vote count. 

Quotes from participants (if any; check data regulations)

If available, add 1–3 brief quotes from the public. These can be statements from the survey responses, quotes collected during interviews and focus groups, or simply messages you already receive during the regular course of your work. In the examples above, names are included, but you may consider making them anonymous. Anonymity is preferred for attribution to ensure compliance with data protection regulations. For specific requirements, consult your data governance framework or laws. For example, “Resident Neighborhood A.”

Next steps: With reference to the results, you should explain how the results will be used and next steps, including plans for dialogue.

Briefly present the work done or progress made to date to address these prioritized issues in 3–5 sentences or bullet points. It is likely that the survey is not the first indication that the city has a problem with, e.g., roads or schools. You may say, for example, “Roads are also our priority, and so far, we have done . . .” If additional work is planned, explain what.

Call to action: Invite members of the community to get involved, and include one or two specific ways for them to do so (e.g., attend a dialogue activity).

Now that you have reported back on findings, listed priorities, and provided a brief overview of your actions to date and plans, you should reopen the door to public feedback. How can the public get in touch with you? How can they stay informed of progress?

End of step checklist

  • The team has presented initial findings of public feedback to internal stakeholders.
  • The team has identified and discussed an initial list of feasible responses to public priorities.
  • The team has published a public report summarizing public feedback collected.
  • (Optional if skipping Step 7) The team has published a public report summarizing how the government will respond to public feedback.